1. Executive Summary
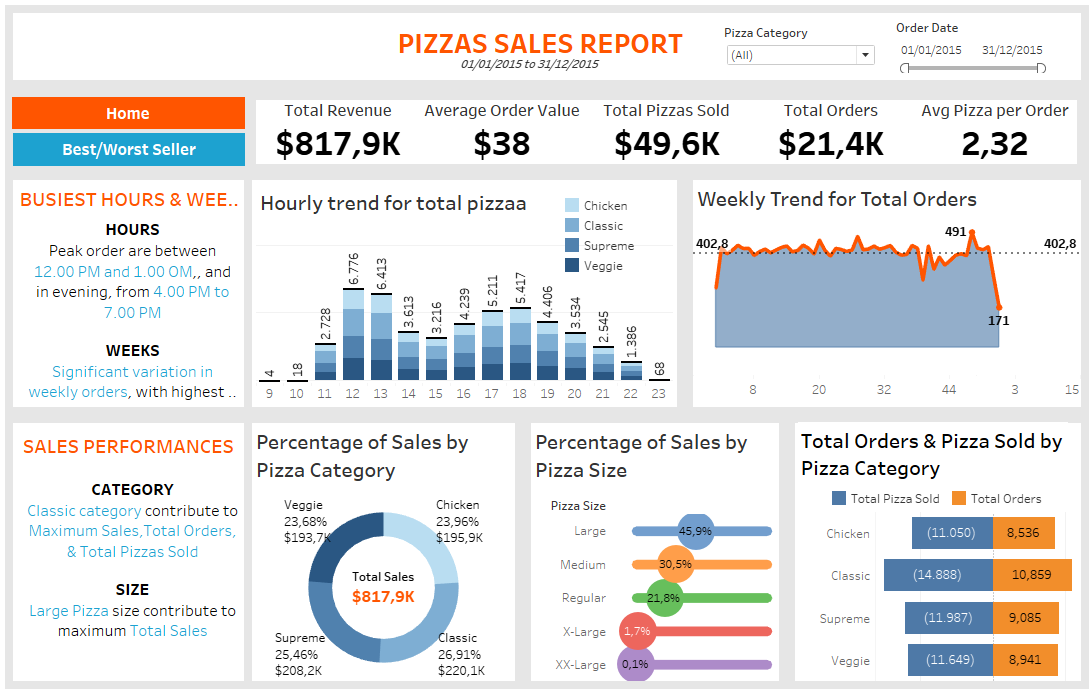
MaPa Pizza’s sales trends reveal critical insights into consumer preferences and operational efficiency. Over 4,862 orders were analyzed to evaluate sales performance, identify peak times, and determine product popularity.
Peak hours are 12:00 PM - 1:00 PMand 4:00 PM - 7:00 PM, contributing 22K orders annually. Week 48 of December saw the highest weekly orders (491), reflecting holiday season demand.
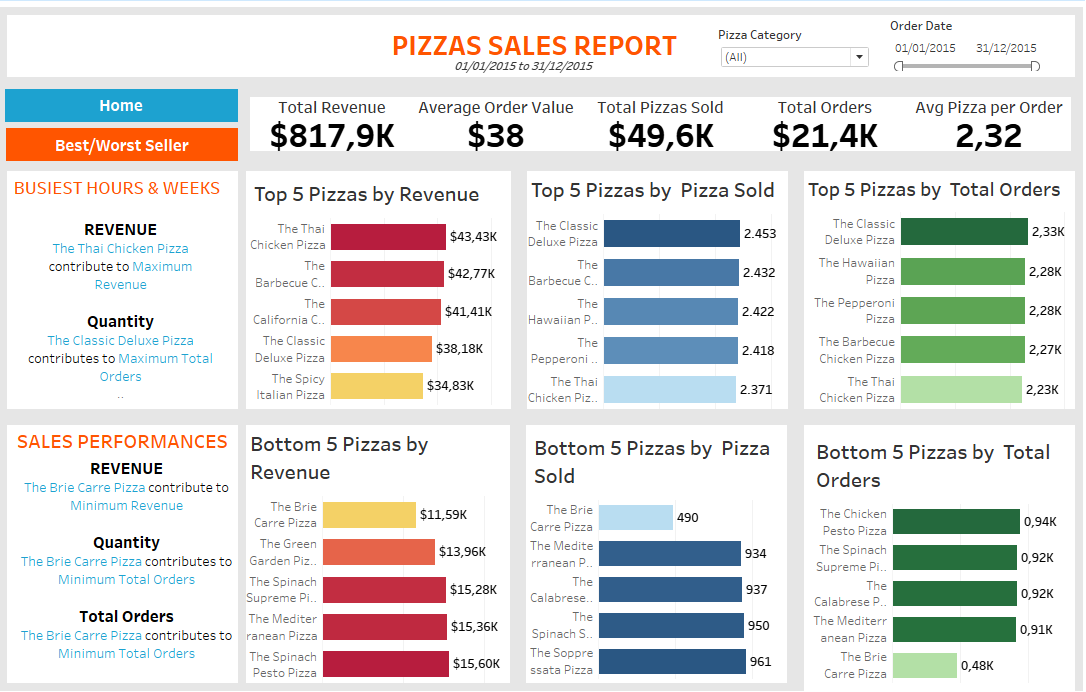
Top performers include the Classic Deluxe Pizza for total orders (2.33K) and the Thai Chicken Pizza for revenue ($43.43K). The Brie Carre Pizza consistently underperformed across all metrics.
2. Data Description
2.1 Dataset Overview
To uncover actionable insights, a dataset with 4,862 rows and 12 columns was thoroughly analyzed. Key columns include:
- Product Details:
pizza_name,pizza_category, andpizza_sizeprovided clarity on consumer preferences. - Transaction Metrics:
total_price,quantity, andunit_pricemeasured financial performance. - Order Time Data:
order_dateandorder_timeallowed the identification of temporal sales patterns.
2.2 Calculations and Metrics Used
Using SQL, the following calculations were performed to distill raw data into actionable metrics:
- Financial Metrics: Total revenue, average order value, and average pizzas per order.
- Temporal Trends: Hourly and weekly sales performance.
- Category Insights: Percentage of sales by pizza size and category.
- Product Rankings: Top and bottom 5 pizzas by revenue, orders, and total sales.
3. Objective
The analysis aimed to assess sales performance, identify trends in consumer behavior, and evaluate product popularity. The ultimate goal was to uncover actionable insights to drive revenue growth.
4. Key Results
Busiest Hours and Weeks
Lunchtime (12:00 PM - 1:00 PM) accounted for over 13K orders, reflecting strong midday demand. Similarly, the evening hours of 4:00 PM - 7:00 PM saw another significant surge, with over 9K orders, likely due to family dinner preferences. Week 48, coinciding with the December holiday season, saw the highest order count (491), signaling seasonal purchasing trends that warrant focused marketing campaigns during this period.
Sales Performance by Category and Size
Classic pizzas stole the show, contributing 26.91% of total sales (~220K pizzas). This category’s widespread appeal suggests it’s a safe bet for sustained promotion. When it comes to size, Large pizzas contributed 45.9% of total revenue, signaling that upselling larger portions could maximize profits.
Best and Worst Sellers
At the top of the charts, the Thai Chicken Pizza led revenue generation, contributing $43.43K, while the Classic Deluxe Pizza dominated in total orders (2.33K). On the other end, the Brie Carre Pizza struggled across all metrics, with revenue barely reaching $11.59K and only 480 orders, suggesting potential misalignment with consumer preferences.
5. Recommendations
- Revitalize Low Performers: Adjust pricing, marketing, or recipes for Brie Carre Pizza to boost appeal. Begin implementation in Q1 next year, led by the Product Development and Marketing teams.
- Capitalize on High Performers: Create combo offers featuring the Thai Chicken Pizza and upsell Classic Deluxe Pizza during peak times. Launch immediately for the holiday season.
- Optimize Operations: Align inventory and staffing with peak demand times to improve efficiency. Test a loyalty program targeting lunchtime and dinner customers within the next 2 months.